
Boris Johnson has staked his hopes on winning over Brexit Party voters to the Conservatives. As Nigel Farage looks set to challenge Boris Johnson’s commitments on Brexit, much depends on who can best persuade these voters in the coming weeks: Johnson or Farage. The Brexit Party is a new phenomenon, and so understanding the party’s voters is crucial to assessing the viability of this strategy come December 12th. The British Election Study Internet Panel (BESIP) gives us a unique insight into Brexit Party voters. We surveyed voters just after the European Parliament elections in May 2019. In this blog we compare Brexit Party voters just after this year’s European Parliament elections to UKIP voters just after the 2014 European Parliament elections; equivalent elections in which these parties did remarkably well, both preceding pivotal moments in a subsequent general election.
There are four lessons we draw from our analysis:
Photo credit: Marco Verch
1. If anyone can challenge Nigel Farage for Brexit Party voters, it is Boris Johnson
Using the 2019 post-EP elections data (wave 16 of the BESIP), we look at the likelihood of voting for the Brexit Party in those elections by ratings of different leaders. Boris Johnson was not yet Conservative Prime Minister, and his ratings (on a 0-10 scale) are taken from the earlier wave of the BES, wave 15 (March 2019). This shows that even before Boris Johnson became Prime Minister, he was far more popular than Theresa May among these voters, and almost equally liked as Nigel Farage – their actual, and very popular, leader.
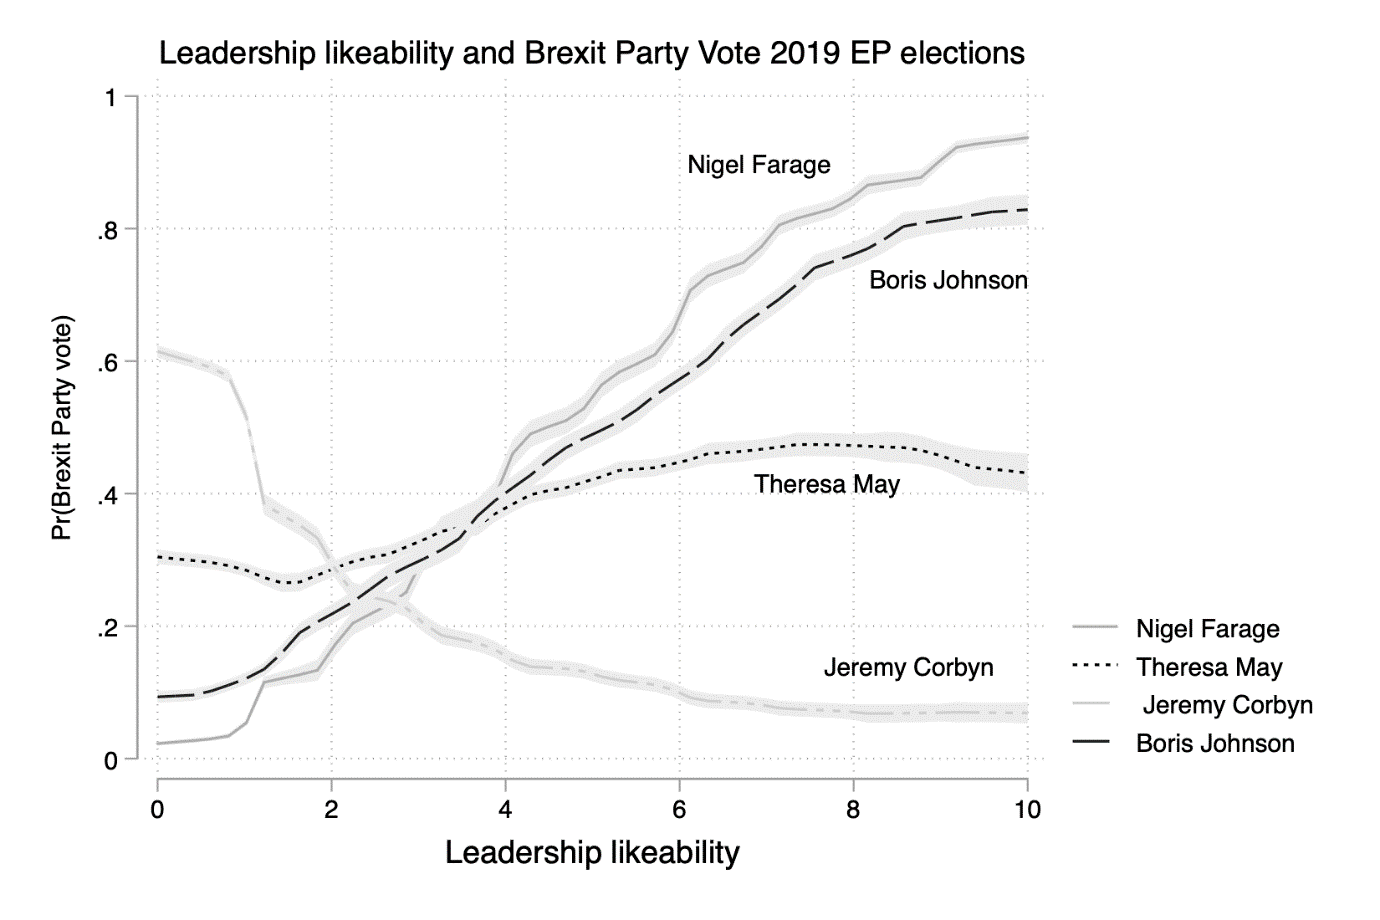 Figure 1 – Leader likeability ratings and Brexit Party vote in the 2019 EP election
Note: This figure shows the relationship between Brexit Party vote and leadership likeability. It includes only people who voted in the European elections. The y-axis is the probability of voting for the Brexit Party in the 2019 European elections
Given that leadership mattered substantially for UKIP voting (Evans and Mellon 2015) , it seems likely that the loyalty of Brexit Party supporters might be severely tested in a general election where Boris Johnson is leading the Conservatives. However, a challenge between Nigel Farage and Boris Johnson for Brexit Party voters is impossible to call. Both leaders might have similar sway and ability to persuade these voters, depending on their willingness to accept the Brexit extension and Boris Johnson’s Withdrawal Agreement Deal.
Of course, Boris’s hard-line approach to the EU may put off more moderate Conservatives who supported Theresa May. Although Johnson was liked far more by European Parliament Brexit Party voters than May, he was disliked more by those who voted for the Conservative party in the European Parliament elections: Johnson received only an average 4.4 rating from Conservative voters compared to May’s score of 6.9.
2. Brexit Party and UKIP voters are extremely similar in their demographics
Who are these voters that both leaders need to appeal to in the coming weeks?
We analysed the relationship of demographics to UKIP vote choice in 2014 (EP election) and Brexit Party vote choice in 2019 (EP). Figure 2 presents the likelihood of supporting UKIP or the Brexit Party for different socio-demographic groups measured in the post-EP waves of the BESIP in 2014 and 2019 respectively (waves 2 and wave 16).
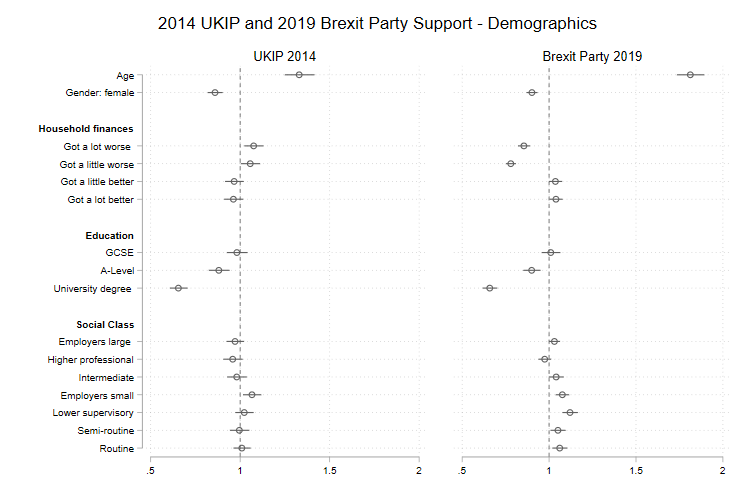
Figure 2 – Demographics predicting UKIP and Brexit Party votes
Note: Reference categories for Education are no qualifications/below GCSE, for class, lower professional/managerial, for household finances: “stayed the same”. Coefficients displayed are odds ratios, variables are standardized.
The general pattern is one of similarity between the socio-demographic bases of support for the two parties. Age and education dominate with support for both parties being drawn from older and less educated groups, but the effect of age on support for the Brexit Party is stronger than its effect on support for UKIP. We also see the commonly observed propensity for men to be more supportive than women of radical political parties. A similar shared appeal is seen among ‘small employers & the self-employed’ – a long-established heartland for the radical right. There are some differences however: the lower supervisory class is pro-Brexit Party, but not pro-UKIP. Interestingly, although there are modest negative effects of recent economic experiences on UKIP support there are positive coefficients for the Brexit Party. [This differs slightly if we use the pre-EP election waves: the effects of economic retrospection on UKIP vote are no longer significant. We still see that those who are more negative about their finances are less likely to vote for the Brexit Party.]
3. UKIP and Brexit Party voters care about similar things
While the demographic basis of UKIP and Brexit Party support has changed somewhat, we also need to know what motivates these voters in their support for both parties.
Figure 3 shows the results of regression models of UKIP and Brexit Party support on voters’ attitudes and perceptions. These include English nationalism, disapproval of immigration, attitudes towards redistribution, EU attitudes, leader evaluations and dissatisfaction with democracy. These capture the typical range of concerns and motivations associated with radical right party voting, including the extent to which support for the radical right reflects a general frustration with politics, a commonly cited reason for radical right protest votes.
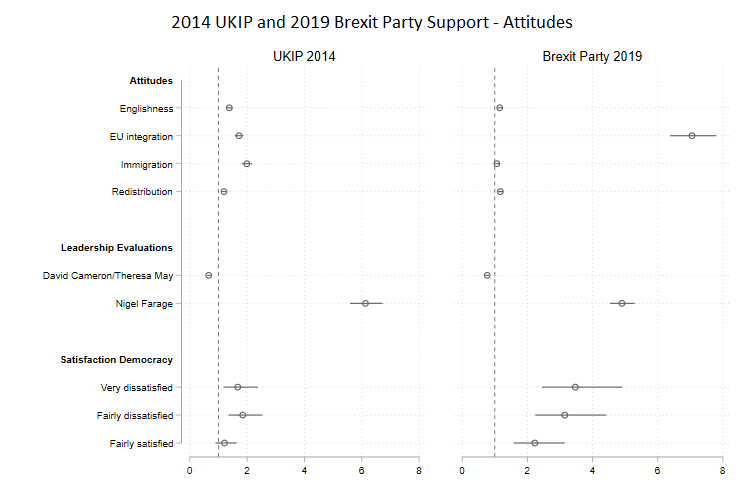
Figure 3 – Attitude and perceptions predicting UKIP and Brexit Party votes
Notes: Higher values reflect more anti-immigrant sentiments, more anti-redistribution attitudes, and a more negative view of European integration, and positive approval of party leaders. The democratic satisfaction base category = very satisfied. Coefficients displayed are odds ratios; variables are standardized.
There are clear differences in the relationships of attitudes and vote choice across the two elections. Brexit Party votes in 2019 were far more associated with Euroscepticism than UKIP votes in 2014, and less associated with concerns over immigration. Dissatisfaction with the democratic process increases substantially in its effect. The reasons for these changes are likely to be that (i) Brexit has structured vote choice more in this period; (ii) immigration has declined in salience as EU immigration has declined in reality, and (iii) the failure of the government to progress to any exit, of whatever form, from the EU has left a heightened sense of frustration with the workings of parliament.
There is, then, an attitudinal difference between UKIP and Brexit Party support, notwithstanding their similar demographic base.
4. These are many of the same voters
The unique inter-European Parliament elections panel design of the BESIP allows us to look at the flow of vote for the same survey respondents between the two European Parliament elections. We can, of course, only do this for people who were in both waves of the panel; in 2014 and 2019, and so this does not include new entrants and defectors in 2019. It shows us that – to a large degree – Nigel Farage was winning the same voters in 2019 as he was in 2014; simply translating their support from UKIP to the Brexit Party.
Figure 4 shows a remarkably high level of overlap between 2014 UKIP voters and 2019 Brexit Party voters: approximately 80% of 2014 UKIP voters voted for the Brexit Party in the 2019 elections and 68% of the Brexit Party voters had voted for UKIP in 2014. By comparison, the consistency between 2014 and 2019 EP elections is much lower for the Conservatives and Labour. Only 29% of 2014 Conservative voters voted for the Conservatives again in 2019 (21% went to the Liberal Democrats and 32% to the Brexit Party). The Labour party does only slightly better, 35% of their 2014 European voters stay with them in 2019, but they lost 10% to the Brexit Party, 28% to the Liberal Democrats and 15% to the Green Party. Overall, the Brexit Party took 16% of its support from Conservative voters in 2014, but only 6% from former Labour voters.
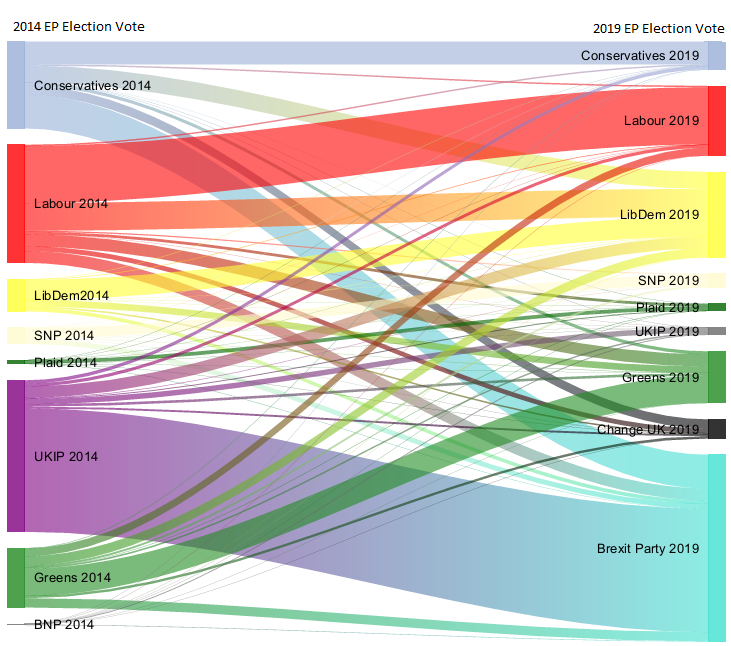
Figure 4 – Flow of the vote between 2014 and 2019 European Parliamentary elections
Included are BES internet panel respondents with a recorded vote choice in both the 2014 and 2019 European Elections. Data is weighted, ‘don’t know’ responses excluded. N = 4,998 respondents.
No other political party had retention and recruitment rates approaching the level attained by UKIP/The Brexit Party across the 5-year period between the two EP elections.
This tells us that these voters are highly loyal to Nigel Farage come European Parliament elections. But what about translating that support to the same party come the general election? When asked just after the 2014 European elections, 53% of respondents who voted for UKIP in the European elections stated they intended to vote for UKIP in a potential general election, 23% intended to vote for the Conservative party and 12% were undecided. In fact, of the 53% of 2014 UKIP voters who stated they would vote for UKIP in a general election, only 55% report actually voting for UKIP in 2015. A further 25% voted for the Conservatives and 8% voted for Labour, while 7% reported not voting. So, around half of UKIP’s 2014 EP voters intended to vote for UKIP in the general election, and roughly half of those actually did so.
In June of this year, no less than 64% of Brexit Party supporters stated that they also intended to vote for the Brexit Party in a general election, while only 16% intended to vote for the Conservative party and 14% were still undecided. Much has happened since June, with the Brexit Party’s support in the polls roughly mirroring what our respondents told us about their vote intentions in a future election. Whether that vote translates into general election votes for the Brexit Party remains to be seen.